City looking at prioritizing roadway safety issues based on stats
The City of Hamilton has released its first annual traffic safety report with statistics and trends associated with traffic collisions that have happened in Hamilton. (City of Hamilton)
“The 2017 Annual Collision Report” breaks down 13 sections, addressing things like red-light camera statistics, Lincoln Alexander Parkway collision statistics, pedestrian and cyclists collisions and overall trends.
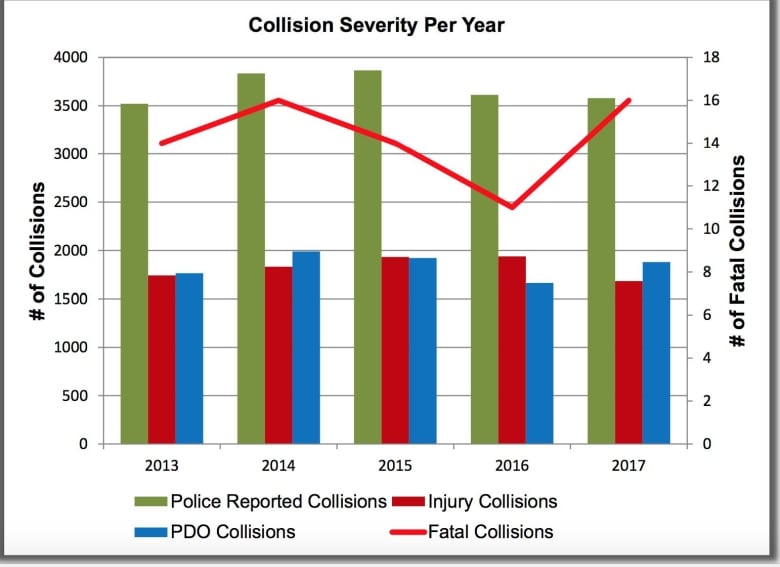
Between 2013 and 2017, there was an average of 8,202 total collisions and an average of 1,825 collisions resulting in injuries on Hamilton roadways each year, including an average of 14 fatal collisions.
That totals 41,098 collisions in five years and of those, 71 were fatal.

(City of Hamilton)
The stats were presented at a general issues committee meeting Wednesday, just days after the public works committee voted to spend money on traffic calming, speed limit reductions, flashing signs, lawn signs, education campaigns and other measures.
The report is a collaborative effort between the public works department, Hamilton police services, Hamilton fire department and healthy and safe communities department.
The city says it’s the first annual edition of a “high-level” review of motor vehicle collisions occurring on Hamilton roadways.
“The statistics and analysis will provide the Hamilton Strategic Road Safety Committee with the information to identify priority roadway safety issues,” read the report.
(City of Hamilton)
When it comes to deaths in 2017, 50 per cent happened on rural roadways and the other half on urban roadways.
Thirty-one per cent of fatal collisions in 2017 were the result of a single motor vehicle, 25 percent were caused by head-on collisions, 25 per cent were pedestrian/vehicle collisions.
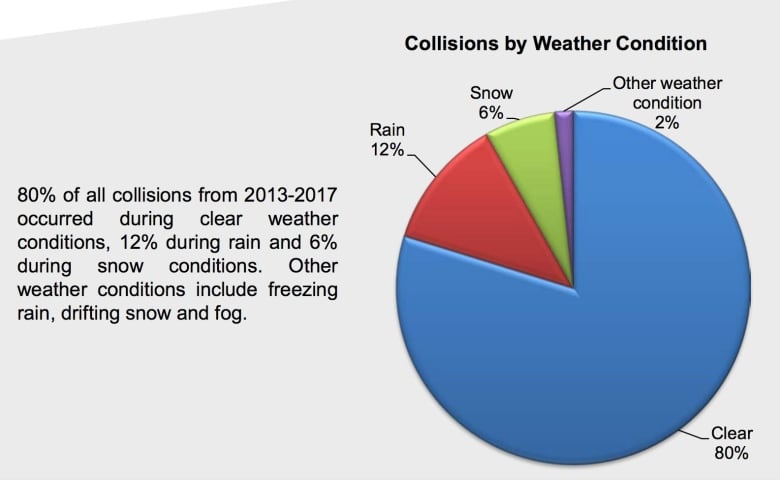
The report says the majority of deaths happened during clear, dry conditions at midblock locations.
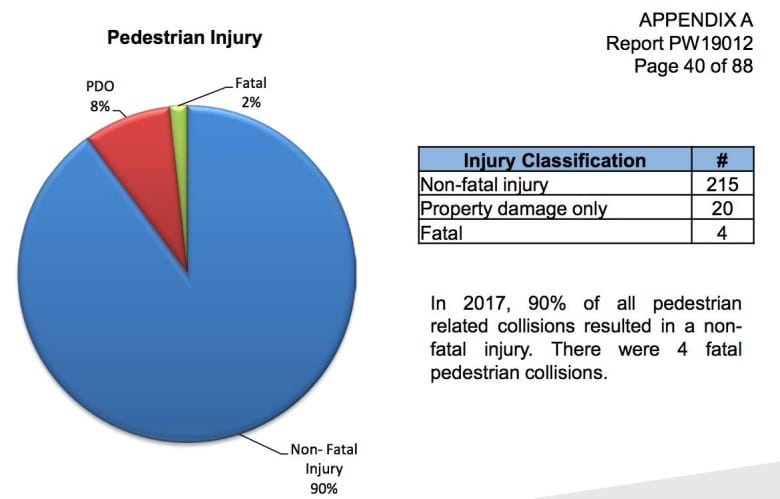
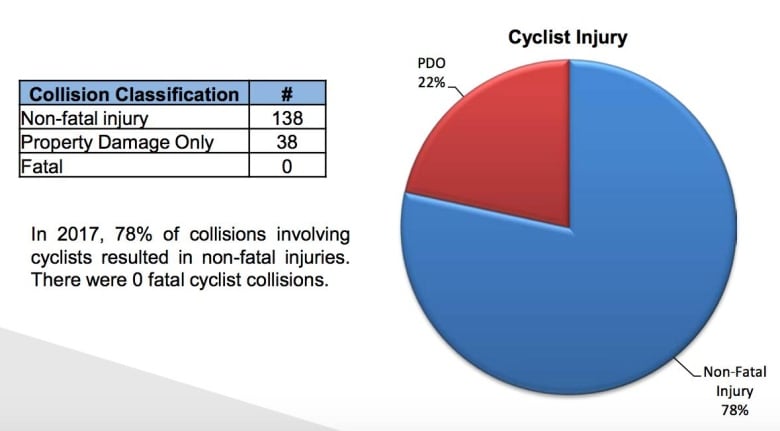
In 2017 there were 239 collisions involving pedestrians and 176 with cyclists.
(City of Hamilton)
(City of Hamilton)
Collisions by time
Over the past five years, the highest average number of collisions happened in October with April seeing the lowest average.
The report goes further breaking down the timing. Friday claims the highest day of the week for collisions accounting for 16 per cent with Sunday at 11 per cent.
The highest collision hour falls from 2 p.m. and 3 p.m.
(City of Hamilton)
Dundurn Street and King Street is the intersection with the highest number of collisions, Kenilworth Avenue and Main Street has seen the most pedestrian collisions and Cannon Street and Wellington Street has the highest number of cyclist collisions.
Source: CBC News